
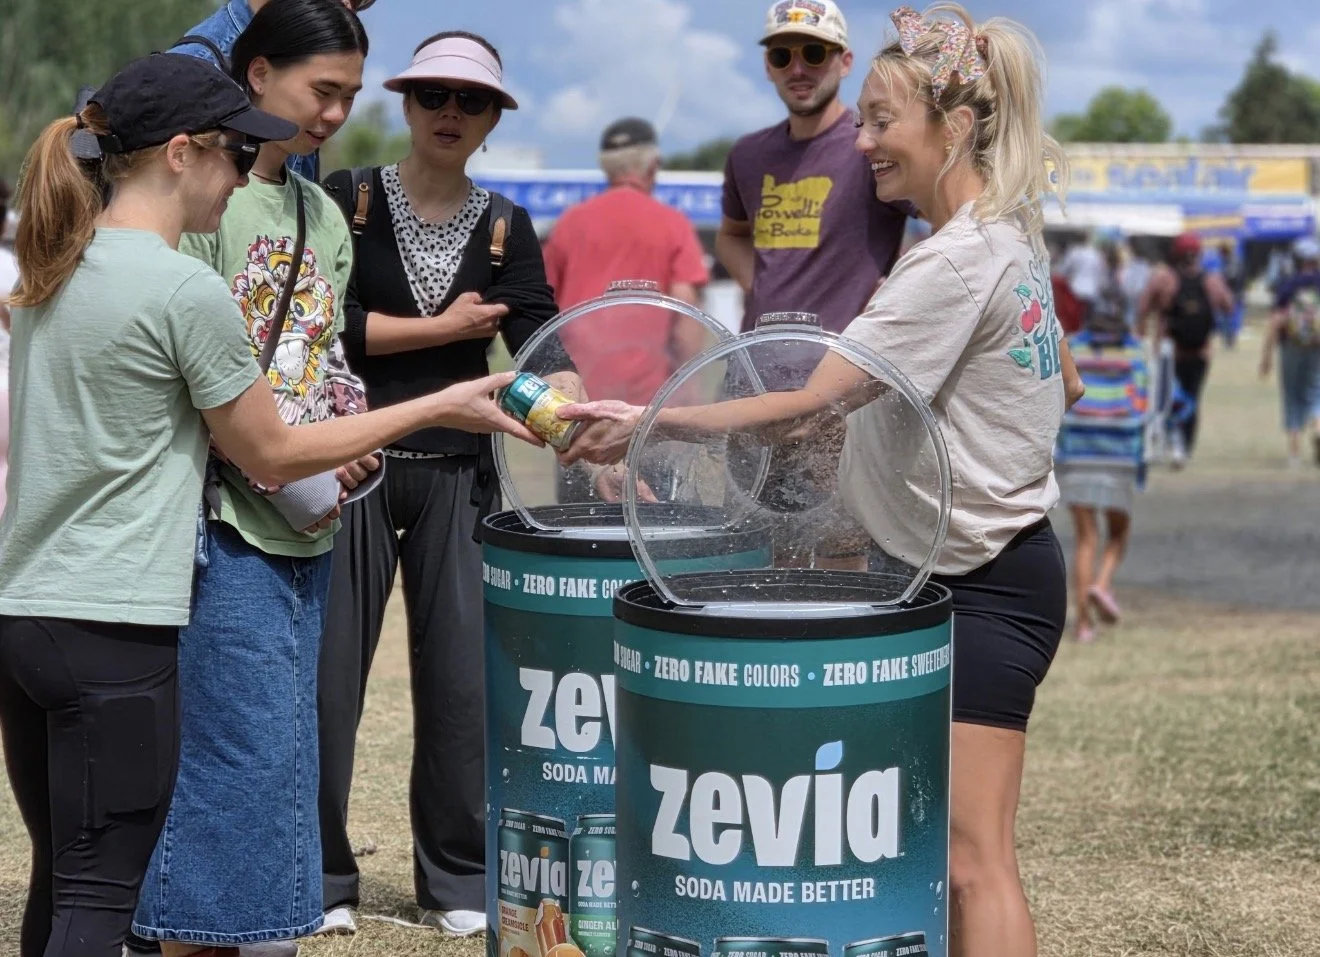
Experiential Marketing event for Zevia.
Most experiential ROI reports are fiction. Not because the numbers are invented, but because they count gross revenue, skip the baseline, and stop measuring the day the truck pulls away. Here's how to measure ROI on experiential marketing in a way a CFO will actually accept — the metrics that matter, the formula, and a worked example with real math.
Start With the Objective, Not the Spreadsheet
You can't measure a sampling program and a sponsorship activation the same way. Before anyone opens a spreadsheet, agree on what the activation is for. Awareness, trial, conversion, lead generation, retail velocity and cultural relevance all produce different numbers, and mixing them produces a report nobody trusts.
At Evolve, we define success with the client before launch and pick metrics that map to the business objective, not to what's easy to count. That conversation happens in the brief, not in the wrap-up deck. If your agency shows up with a measurement plan after the event, they're reverse-engineering a story.
One rule saves you months of argument: pick one primary metric and no more than three supporting ones. A program with eleven KPIs has no KPI.
The Metrics That Actually Matter
Experiential marketing KPIs fall into two groups. Output metrics tell you what happened on site. Outcome metrics tell you whether it worked. You need both, but you only get paid for the second.
Impressions
Impressions estimate how many people saw the activation, whether they stopped or walked past. They're useful for scale and useless for proof on their own. A festival footprint with 900,000 impressions and 400 samples is a media buy with a tent attached.
Count impressions honestly. Foot traffic counts, verified passersby counts, earned media reach counts separately. Don't blend them into one heroic number.
Samples and Engagements
Samples distributed is the cleanest trial metric in the category. It's binary: the product went into someone's hand or it didn't. Engagements are the deeper version — someone played the game, took the photo, answered the survey, spent ninety seconds with a brand ambassador.
Track both, and track them by daypart and market. A program averaging 800 samples a day can hide a market doing 300 and another doing 1,400. That variance is where your next budget decision lives.
Cost per Sample and Cost per Engagement
These are your efficiency metrics, and they're the fastest way to compare formats and markets. Divide total program cost by samples distributed, or by engagements.
Cost per sample typically runs higher in premium retail environments and lower at high-volume festivals. Neither is better in isolation. A $6 sample in a grocery aisle where the buyer is already holding a basket can outperform a $2 sample at a music festival where nobody's shopping.
Post-Event Lift
Post-event lift is the change in purchase behavior among people exposed to the activation, compared with people who weren't. This is where experiential marketing ROI gets real.
The clean version uses a control group: matched markets, or a holdout audience, measured over the same window. The simpler version uses pre-period versus post-period sales in activated markets, adjusted for the baseline trend. The simple version is directionally useful. The control version survives a finance review.
UTM and QR Capture
Every activation should have a digital handprint. QR codes on signage, sample packaging and premiums route people to a tracked landing page. UTMs separate experiential traffic from paid and organic. Unique codes per market tell you which city actually drove sign-ups.
This is also your first-party data engine. Email capture at a sampling event, opt-ins for a rebate, sweepstakes entries — all of it becomes attributable revenue later. Without capture, your ROI calculation ends at the gate.
One number is worth holding onto before you build your own model. Average event ROI across surveyed marketing professionals sits at 25–34%, according to Anyroad's 2025–2026 benchmark data. If your report claims 400%, check what got counted as revenue.
The Experiential Marketing ROI Formula
The formula is the same one finance uses everywhere. Take your incremental gross profit, subtract the total program cost, divide that figure by the total program cost, then multiply by 100 to get a percentage. That's it.
Two words do all the work here: incremental and gross profit.
Incremental means the revenue that wouldn't have happened without the activation. If you sample in a grocery chain and that chain's sales go up 12% during the program, only the portion above the normal baseline counts. Counting total sales in activated markets is the most common way brands inflate experiential ROI, and it's the first thing a sharp CFO will challenge.
Gross profit means revenue minus the cost of goods. A $9 retail basket at 45% margin contributes $4.05, not $9. Run the formula on gross revenue and you're measuring someone else's money.
Total program cost means everything: fabrication, venue fees, permits, staffing, travel, freight, storage, agency fees, technology, incentives, and the internal labor allocated to the program. The number that appears on the invoice is not the number that goes in the denominator.
A Worked Example
Here's a sampling program with numbers that hold up.
A beverage brand runs a three-market sampling tour: 18 event days, 40,000 samples distributed, total program cost of $120,000. That's a cost per sample of $3.00. The on-site team captures 18,000 engagements, so cost per engagement lands at $6.67.
Thirty days after the program, the brand matches sample redemption codes and retailer loyalty data and finds that 30% of sampled consumers bought the product — 12,000 buyers at an average first basket of $8.50. That's $102,000 in revenue at a 45% margin, or $45,900 in gross profit.
On first purchase alone, the program returns $45,900 against $120,000 spent. That's an ROI of negative 62%. And that's normal. Most sampling programs lose money on the first transaction. Anyone promising otherwise is counting something they shouldn't.
Now extend the window. Of those 12,000 buyers, 30% repurchase three more times over the following twelve months. That's 3,600 households generating $91,800 in revenue and $41,310 in gross profit.
Add tracked retail lift in the three markets over the 90-day window: $210,000 in incremental sales above baseline, at the same 45% margin, equals $94,500 in gross profit. Some of that overlaps with the direct buyers, so the brand applies a conservative 40% credit to avoid double-counting, arriving at $37,800.
Total incremental gross profit comes to $45,900 plus $41,310 plus $37,800, which is $125,010. Against $120,000 in cost, ROI is 4.2%.
A 4% return sounds unimpressive until you see what it represents: a program that broke even in year one and created 12,000 verified new buyers who are still purchasing. Year two carries no acquisition cost on those households. That's the actual asset.
Now run the same program the sloppy way — count gross revenue from all three revenue streams with no margin adjustment and no baseline deduction. You'd report $403,800 against $120,000 and claim 236% ROI. Same program, two completely different stories. One gets budget renewed. The other gets you escorted out of the finance meeting.
How We Measure at Evolve
We build the measurement plan into the program design, not the wrap-up. Every activation gets objectives set before launch, tracking built into the footprint, and reporting that separates what happened from what it was worth.
For Pocari Sweat's U.S. launch, we ran 102 event days across Los Angeles, San Francisco and Houston, distributing 232,081 samples and generating 3,181,751 impressions while adding 10,601 social followers. Those are output metrics, and they're only useful because they ladder up to a defined launch objective: trial and awareness in three priority markets for a brand new to U.S. consumers.
For Kopiko Focus Coffee, the numbers told a different story. A four-week sprint at a Los Angeles gas station produced 9,000 gallons of fuel given away, 950,000 on-site impressions and 119 million in total audience reach, with 43 million social views. That program wasn't measured on cost per sample. It was measured on reach, earned media and cultural relevance, because that's what a new product format needed in week one.
The GURU roadshow ran on weekly objectives. Every week had a target, and every week got checked against it. That cadence matters more than any single end-of-program number, because it lets you fix a market while the program is still running.
If you want the full picture of how we build measurement into activations, our analytics and measurement services cover KPI tracking, ROI management, qualitative research and sponsorship asset valuation.
What to Do When You Can't Prove Revenue
Plenty of activations can't be tied to a transaction. Sponsorships, brand awareness plays, influencer events and B2B hospitality rarely produce a clean sales line.
In those cases, measure what you can defend. Brand lift from pre- and post-event surveys. Aided and unaided recall against a control audience. Qualified leads captured and their pipeline value. Earned media value calculated with a stated methodology, not a multiplier someone made up. Social engagement rate and content created by attendees.
Then be honest about what you're reporting. "We moved aided awareness 9 points in the target demo" is a real result. "We generated 4.2 million impressions" is a receipt, not an outcome.
The brands that get experiential budgets approved year after year do one thing differently: they agree on the measurement plan before the creative, and they report the same metrics every time. Comparability beats sophistication. A simple number you can track across five programs is worth more than a perfect model you run once.
FAQ
How Do You Calculate ROI on Experiential Marketing?
Subtract total program cost from the incremental gross profit the activation generated, divide by total program cost, then multiply by 100. Use incremental revenue above baseline, not total sales, and use gross profit rather than gross revenue. Include every cost — production, staffing, permits, travel, agency fees and internal labor.
What Is a Good ROI for Experiential Marketing?
Benchmark data puts average event ROI in the 25–34% range. Sampling and trial programs often run negative in year one and turn positive once repeat purchase is counted. What matters more than the headline number is whether the metric was defined before launch and whether the baseline was subtracted.
How Do You Measure Experiential Marketing Without Sales Data?
Use brand lift surveys with a control group, aided and unaided recall, qualified lead capture with pipeline value, earned media value with a stated methodology, and first-party data capture through QR codes and UTM tracking. Report those as separate outcomes rather than forcing them into a revenue formula.
What Is Cost per Sample and What Should It Be?
Cost per sample is total program cost divided by samples distributed. It varies widely by format and market — premium retail and staffed brand experiences cost more per sample than high-volume festival sampling. Compare it across your own programs rather than against an industry average, because the definition of "sample" differs by category.
When Should You Measure Experiential ROI?
Set the measurement plan before the program launches, capture data on site, and report at two points: an immediate wrap-up covering output metrics, and a 60-to-90-day post-event read covering purchase behavior and lift. Extend to twelve months if you're counting repeat purchase and lifetime value.
Planning a sampling program or mobile tour and need to prove what it returned? We build the measurement plan into the activation, so the reporting holds up in front of your CFO. Tell us what you're trying to do → Contact Us
